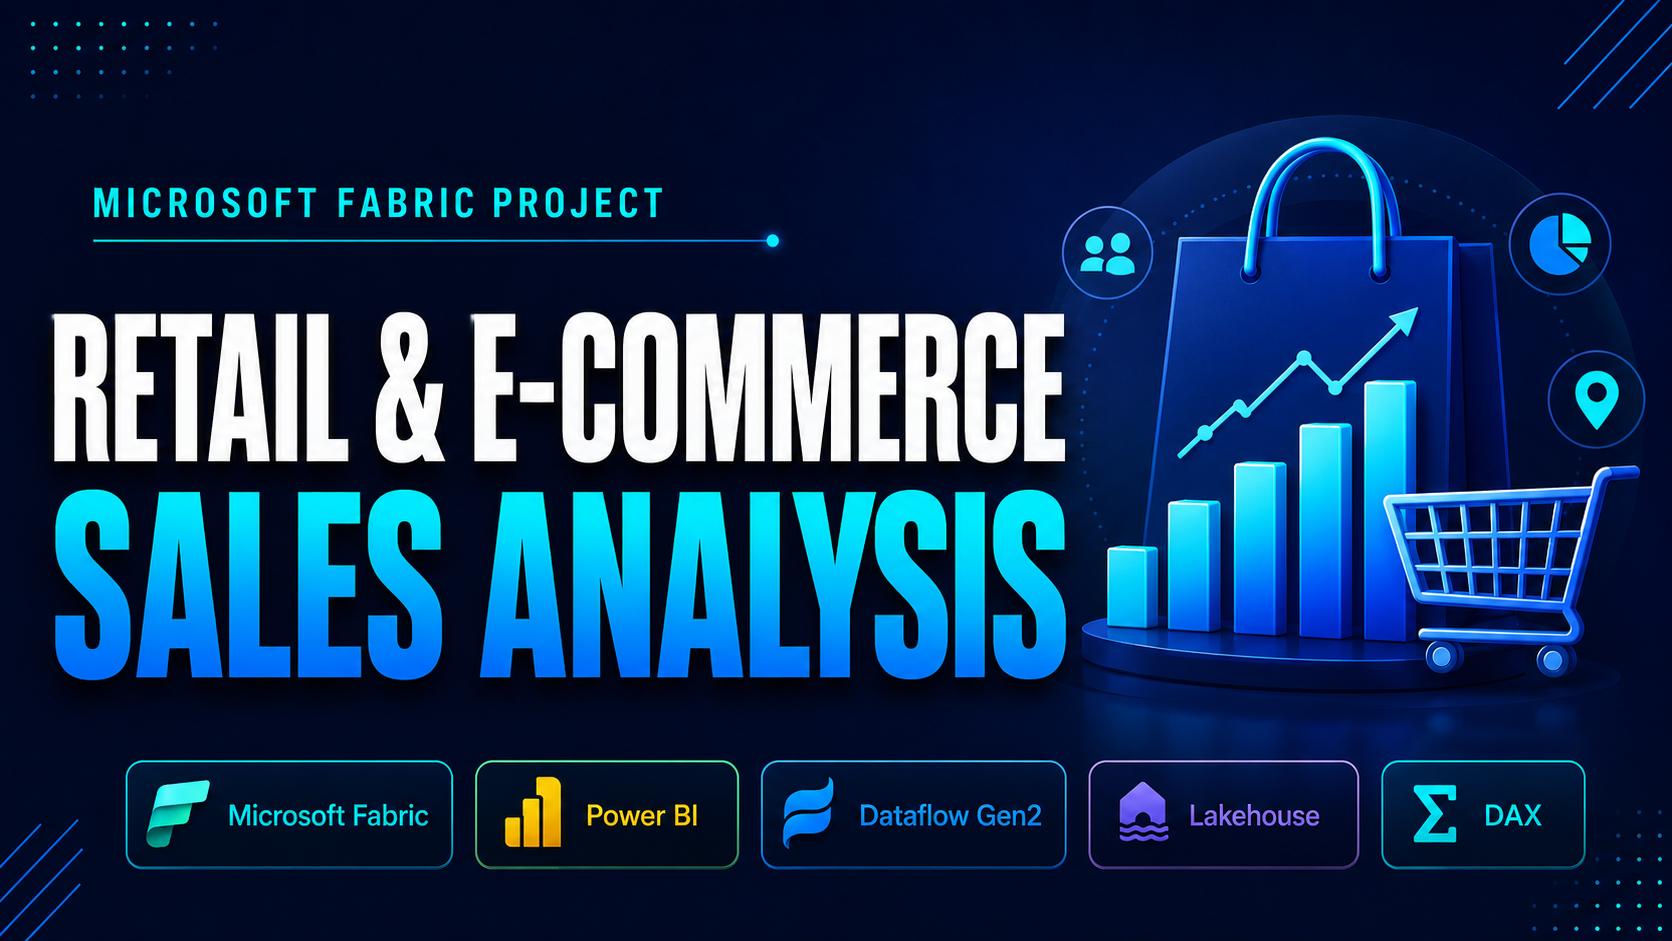
Retail & E-Commerce Sales Analysis
End-to-end Fabric analytics model for sales trends, customer behavior, product performance, refresh automation, and KPI reporting.
Microsoft FabricPower BIDAXLakehouseDataflow Gen2RLSPower Query
Hello, It's Me
I turn raw business data into decisions - clean SQL pipelines, validated Power BI dashboards, and Python automation that saves hours of manual work every week.
Download CV
I turn scattered business data into clean, reliable datasets that support analysis, automation, and confident decisions.
My strength is not just building dashboards; it is understanding the source, checking the quality, finding gaps, and shaping the data so the final numbers are easy to explain and defend.
At Newgen Technomate, I work across data collection, deduplication, validation checks, SQL/Python processing, Excel outputs, and Power BI delivery. My engineering background helps me stay structured, accurate, and consistent when working with messy operational datasets.
I am focused on roles where I can improve data quality, automate repeat work, build useful analysis, and help teams trust the information they use every day.
Graduated with 8.11 CGPA - four years of engineering fundamentals covering mathematics, structural analysis, field documentation, and systematic problem-solving that directly shaped the precision and data discipline I bring to analytics.
A practical transition from field engineering discipline into data ownership - building automated collection workflows, validating source accuracy, shaping analysis-ready datasets, and delivering reports that support daily business decisions.
Started as Junior Data Analyst automating high-volume vendor data collection using Python (Playwright, Selenium, BeautifulSoup), Power Query, SQL, and VBA. Promoted to Data Analyst - took full ownership of the data lifecycle for federal contracting and vendor datasets, delivering SQL-driven insights, Python pipelines, and Power BI dashboards used daily for KPI tracking and business decisions.
Analyzed real-world restaurant datasets end-to-end - EDA, cleaning, and statistical analysis using Python, Pandas, and NumPy. Delivered structured findings with visualisations and a documented methodology report.
Intensive project-based training across the full analytics stack - SQL, Python, Power BI, DAX, and data modeling with hands-on case studies in finance, sales, and supply-chain domains. Built portfolio-quality work throughout the programme.
Field documentation, alignment records, and material tracking for a bridge construction project using Excel-based reporting. Developed an engineer's discipline for structured records, measurement validation, and systematic data hygiene - skills that transfer directly into analytics work.
Six focused areas covering the full analytics lifecycle - collecting raw source data, cleaning and validating it with SQL and Python, shaping reliable models, writing DAX measures, and publishing Power BI dashboards that stay useful after delivery.
Selected analytics builds that show how I approach real business problems - automating repetitive data collection, cleaning imperfect datasets, designing semantic models, tracking KPIs, and turning analysis into dashboards that are easy to act on.
End-to-end Fabric analytics model for sales trends, customer behavior, product performance, refresh automation, and KPI reporting.
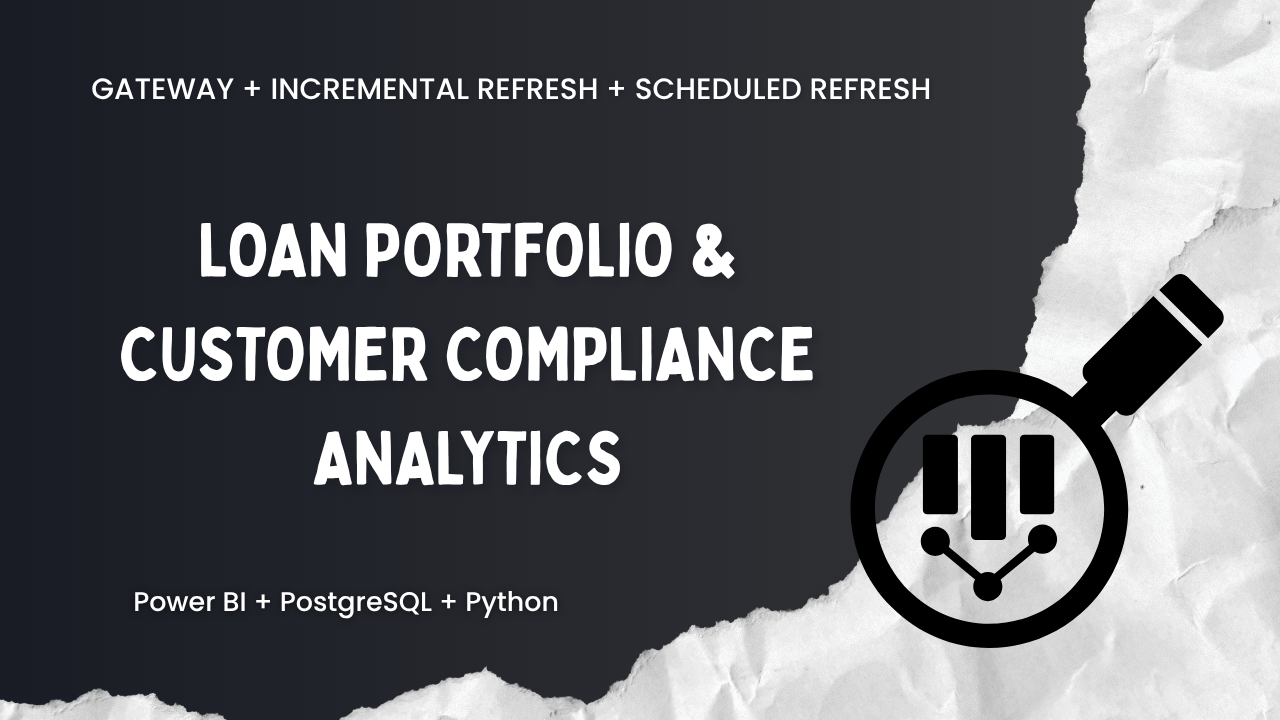
Risk and compliance analytics stack for loan quality, delinquency tracking, PAN/KYC validation, and refresh-driven reporting.
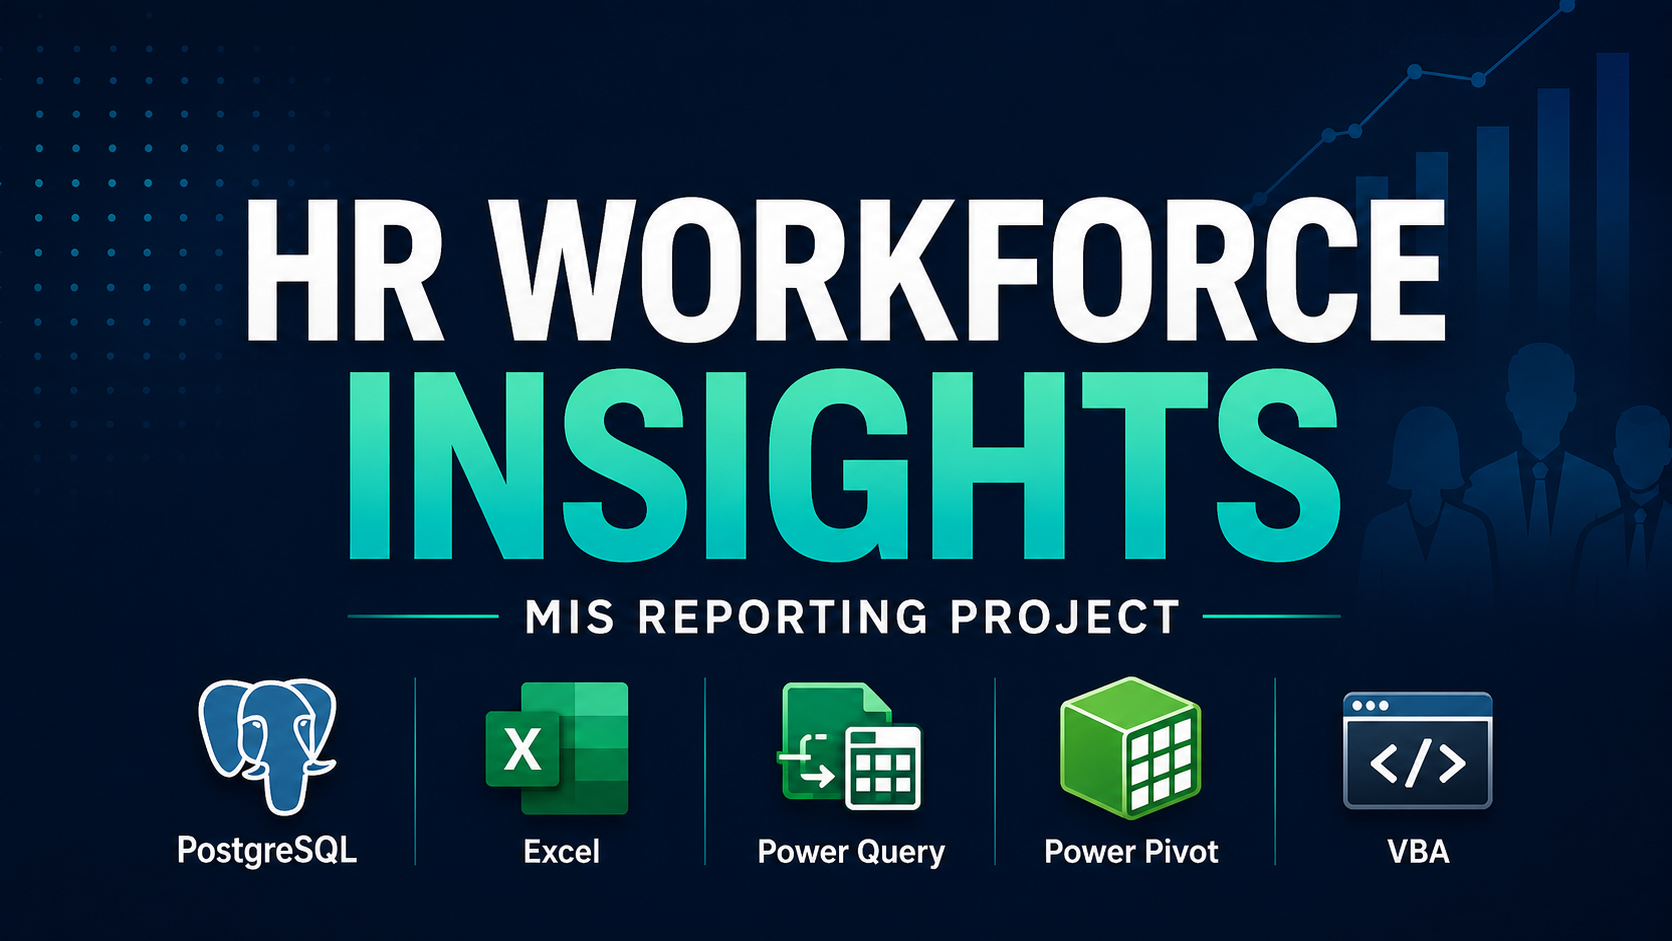
HR MIS reporting workflow for workforce KPIs, SQL validation, Excel reconciliation, and automated monthly report exports.
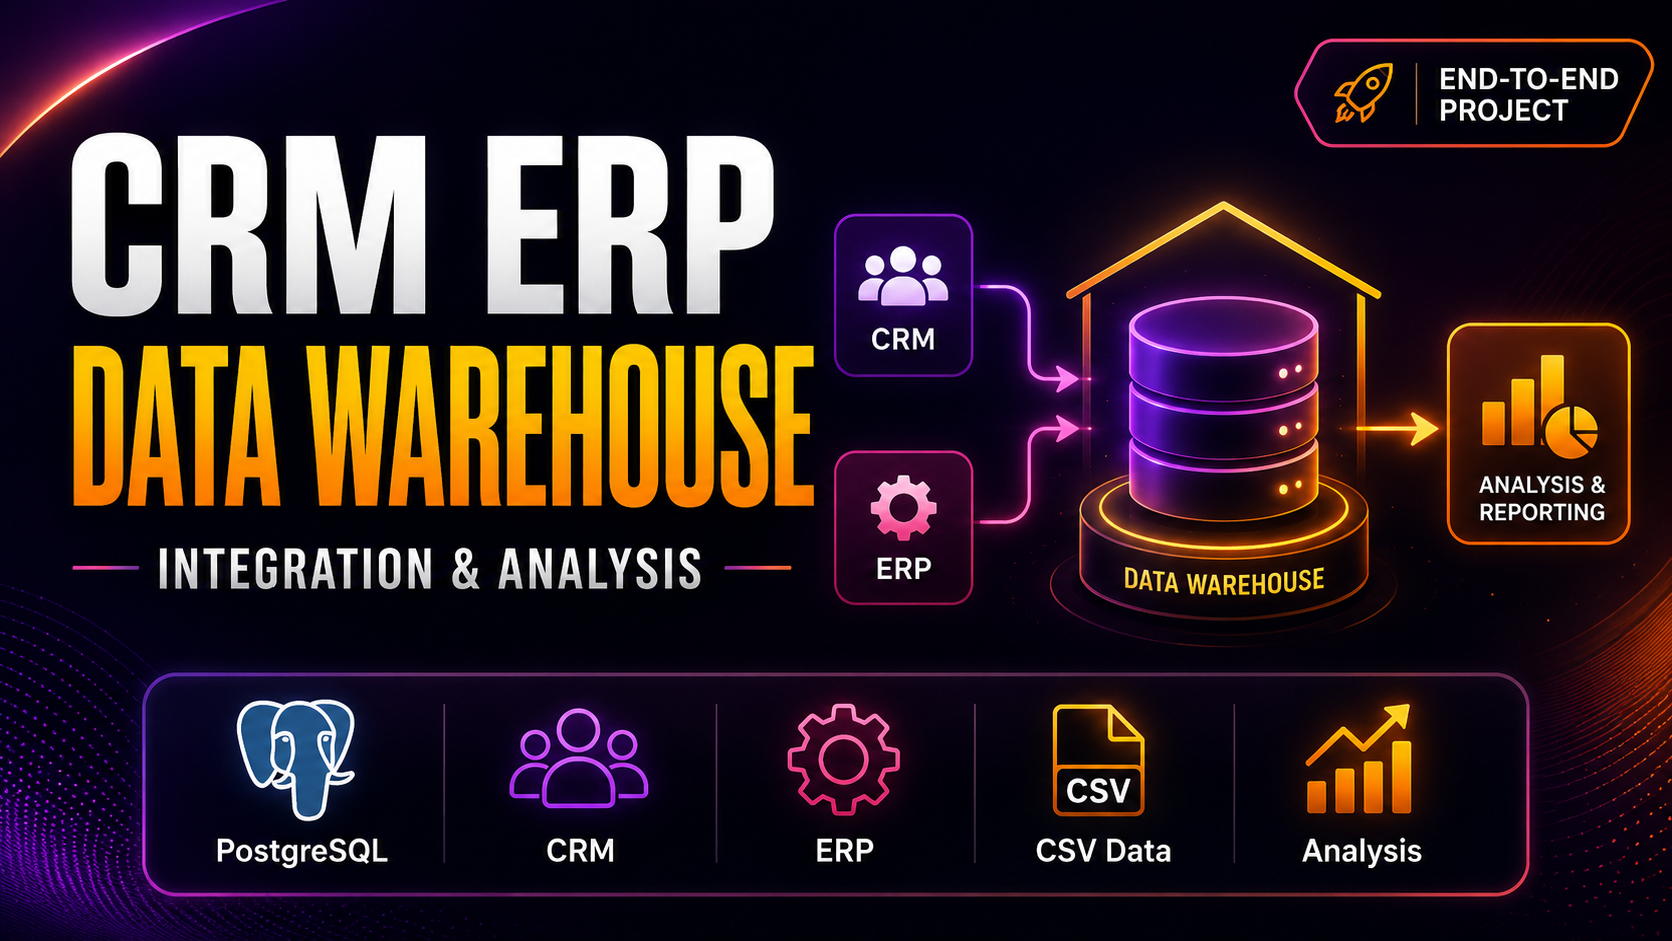
PostgreSQL warehouse project integrating CRM and ERP data for customer, product, sales, and business performance analysis.
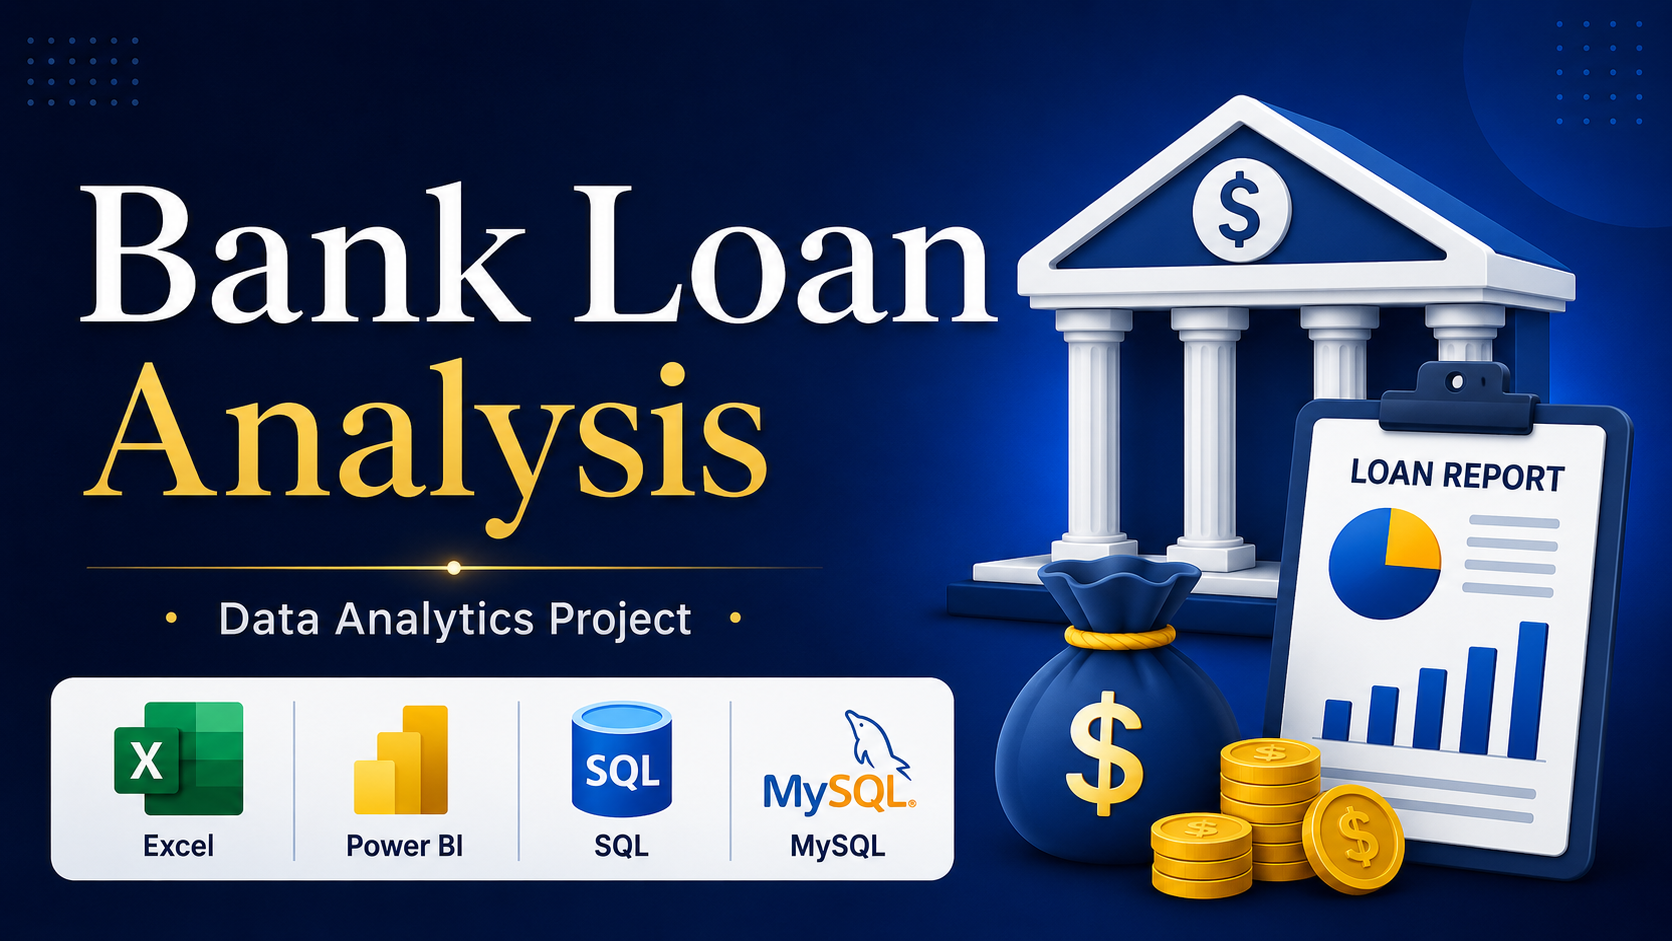
Power BI and SQL loan dashboard tracking applications, funded amount, repayments, interest rate, DTI, and loan quality KPIs.
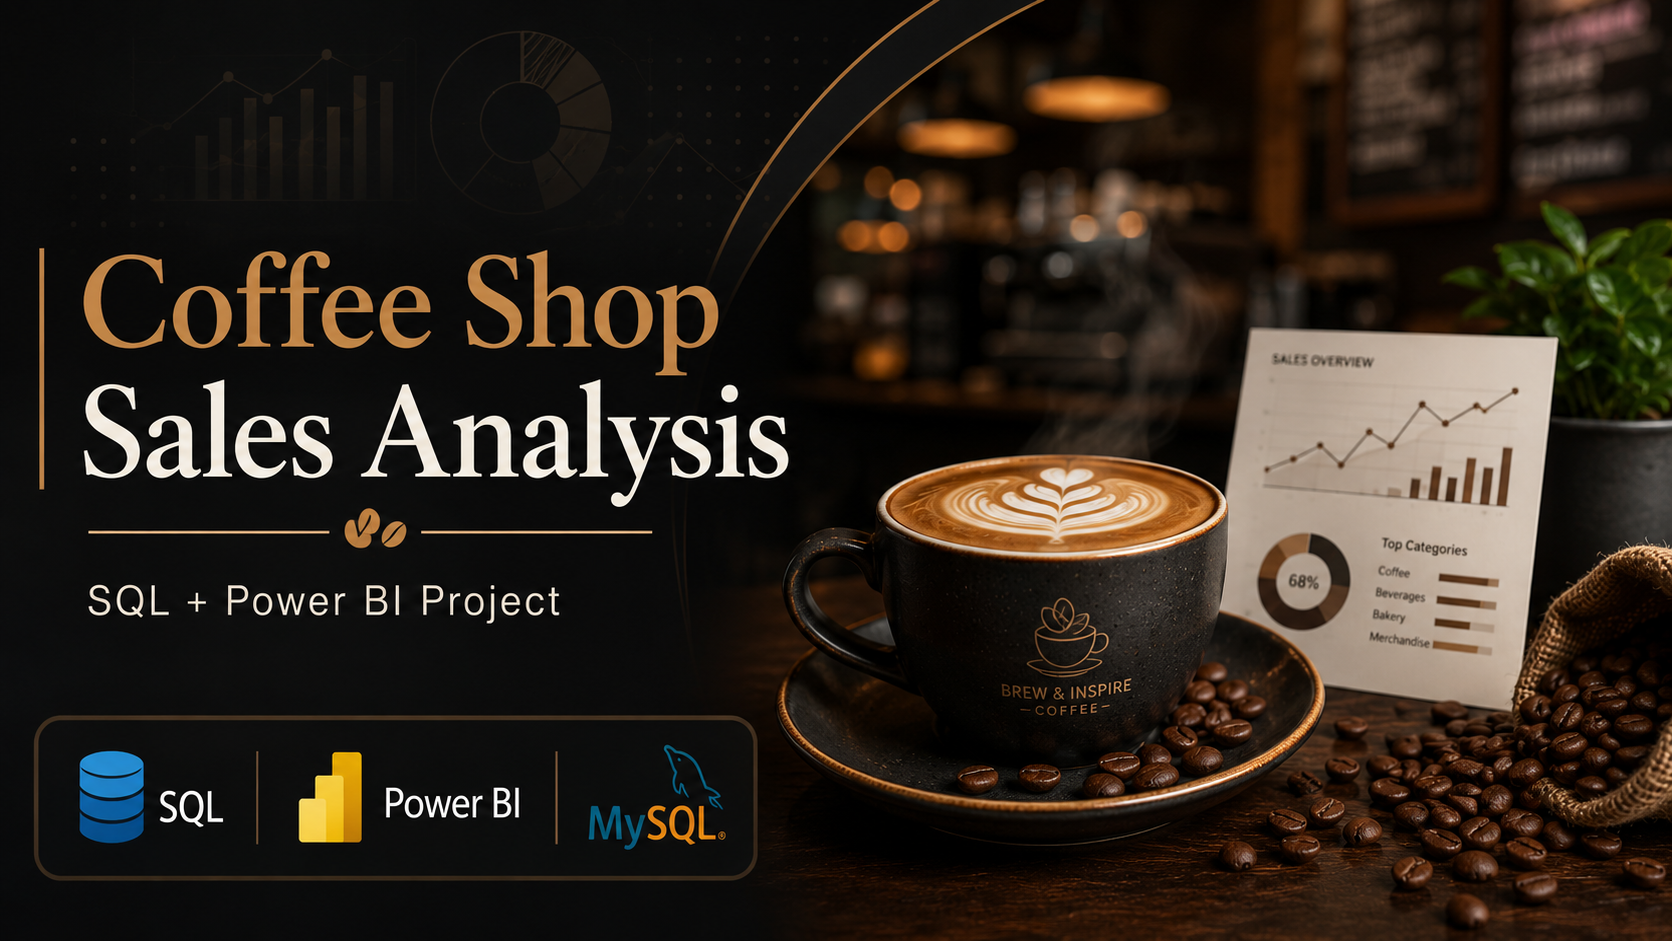
SQL and Power BI dashboard analyzing coffee shop sales, order patterns, product categories, locations, and daily trends.
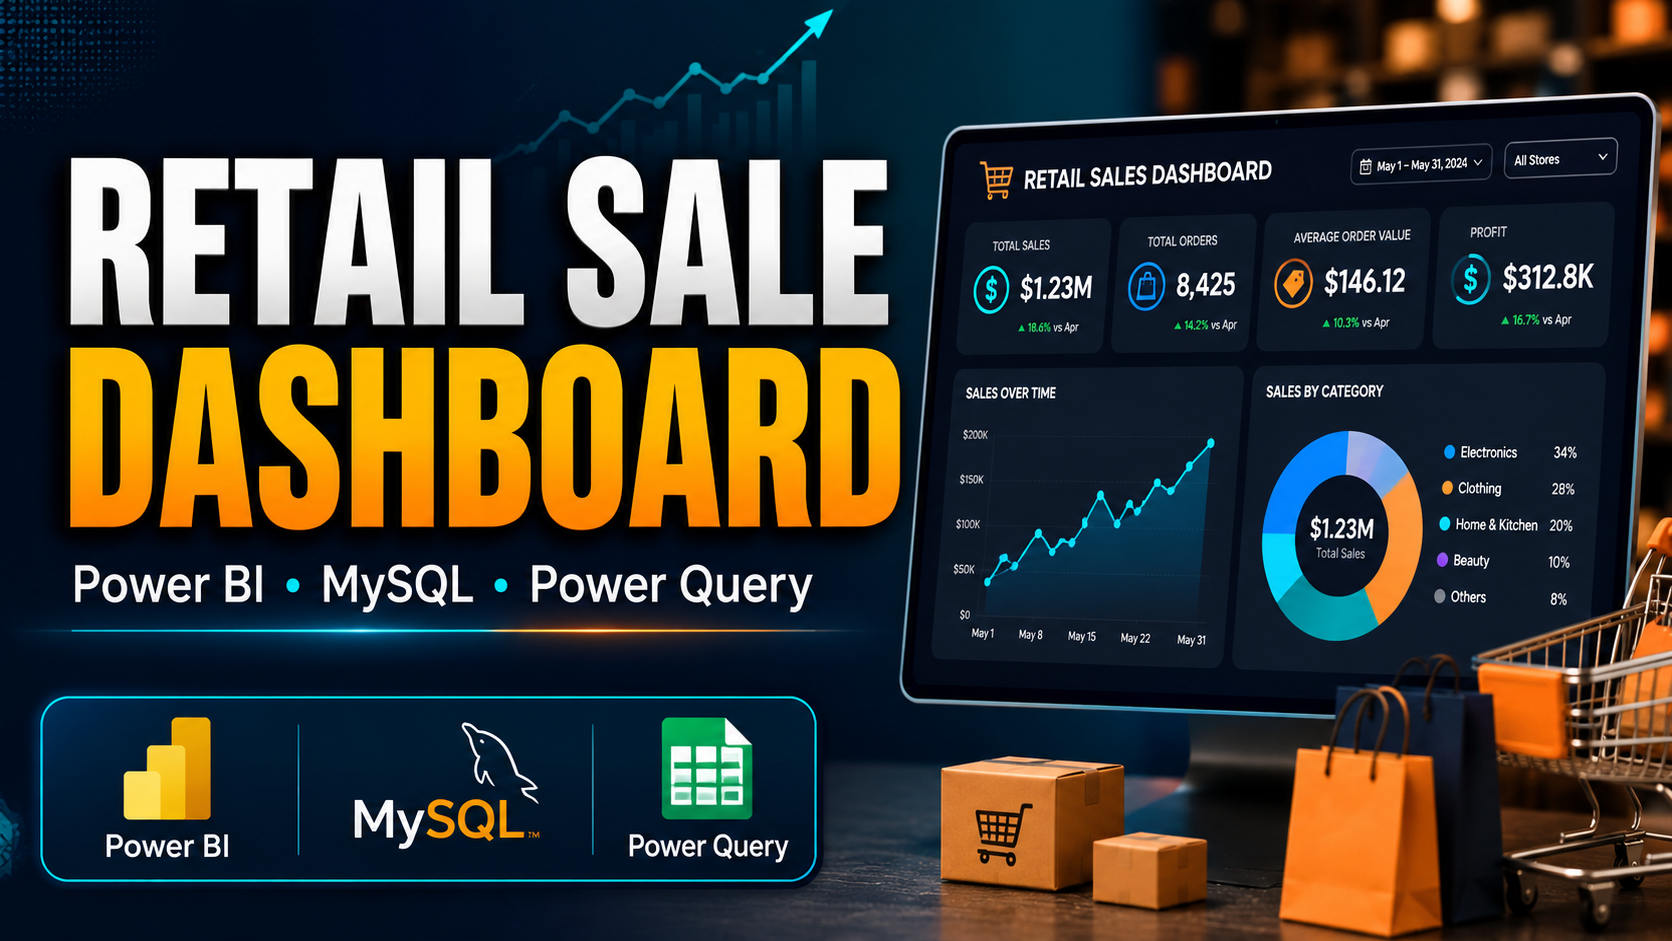
Power BI retail dashboard analyzing sales trends, product performance, customer behavior, profitability, and regional insights.
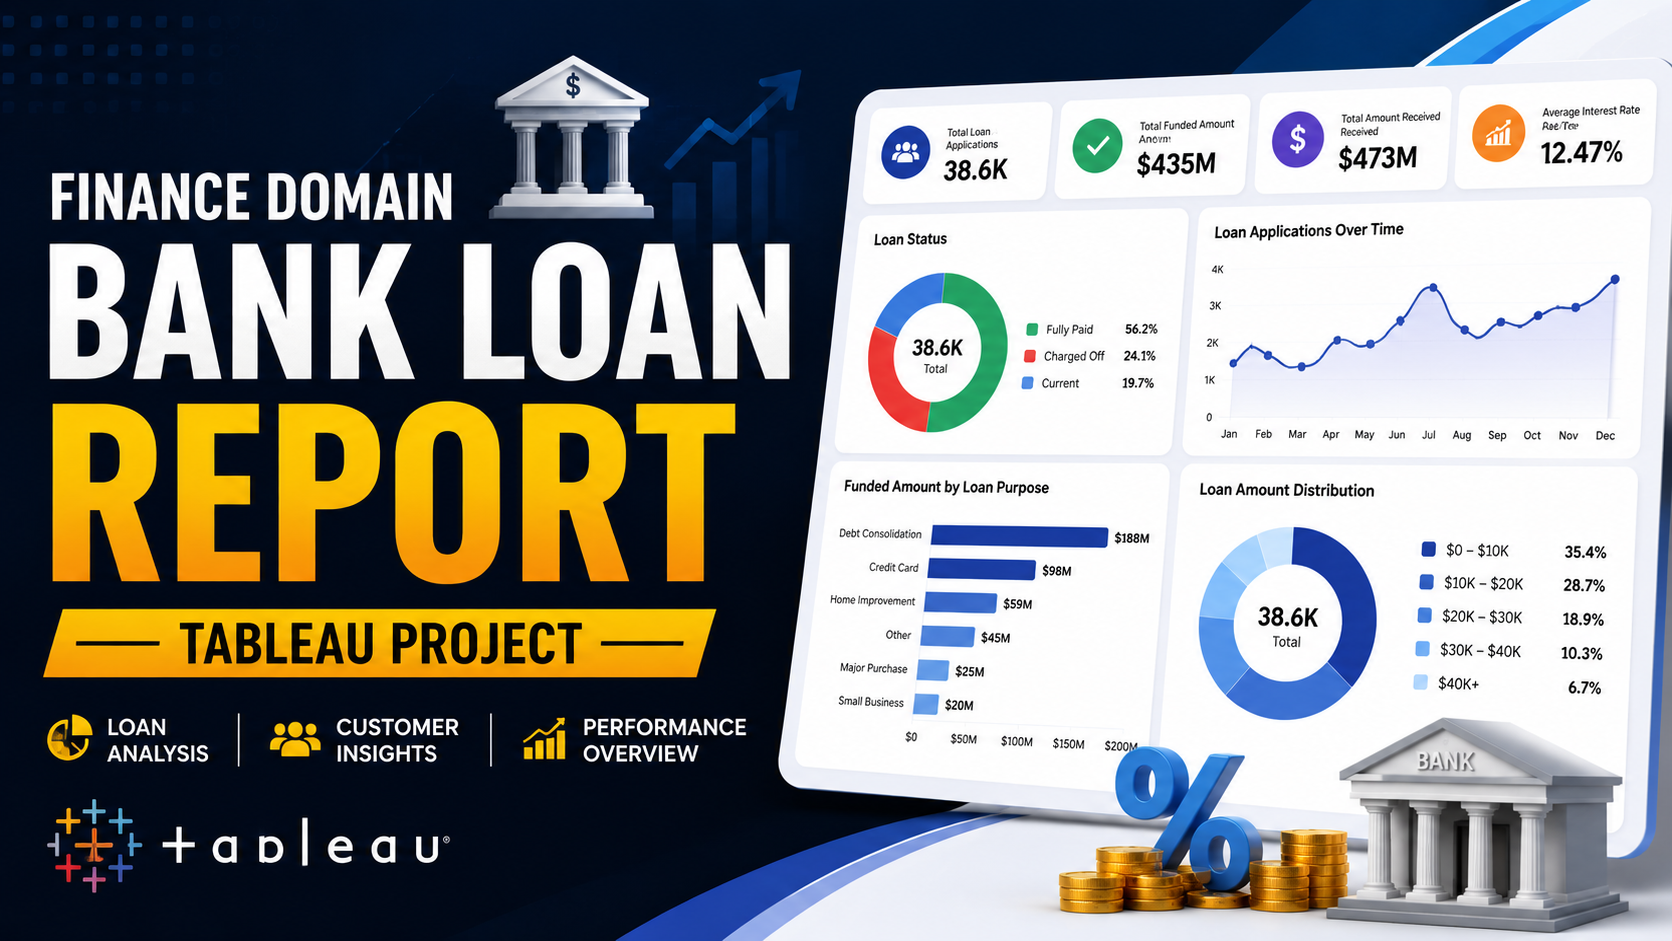
Finance analytics dashboard for loan applications, borrower profiles, repayment behavior, and lending performance KPIs.
SQL-based toy store analysis covering store performance, product sales, inventory movement, and business questions.
Restaurant analytics project for cuisine trends, city performance, price range, ratings, and service availability insights.
SQL and Python sales analysis project exploring customer trends, product performance, revenue patterns, and forecasting.

Smartphone market analysis covering pricing, ratings, processor types, memory support, and product feature comparison.
Python scraping pipeline for extracting website data, structuring tables, cleaning outputs, and preparing analysis-ready datasets.
Sports analytics dashboard analyzing Olympic athletes, medals, country rankings, gender distribution, and performance trends.
Power BI sports dashboard using live Cricbuzz API data for scorecards, player details, and dynamic points table.
SQL database project for library operations, branch records, books, members, CRUD tasks, and advanced query practice.
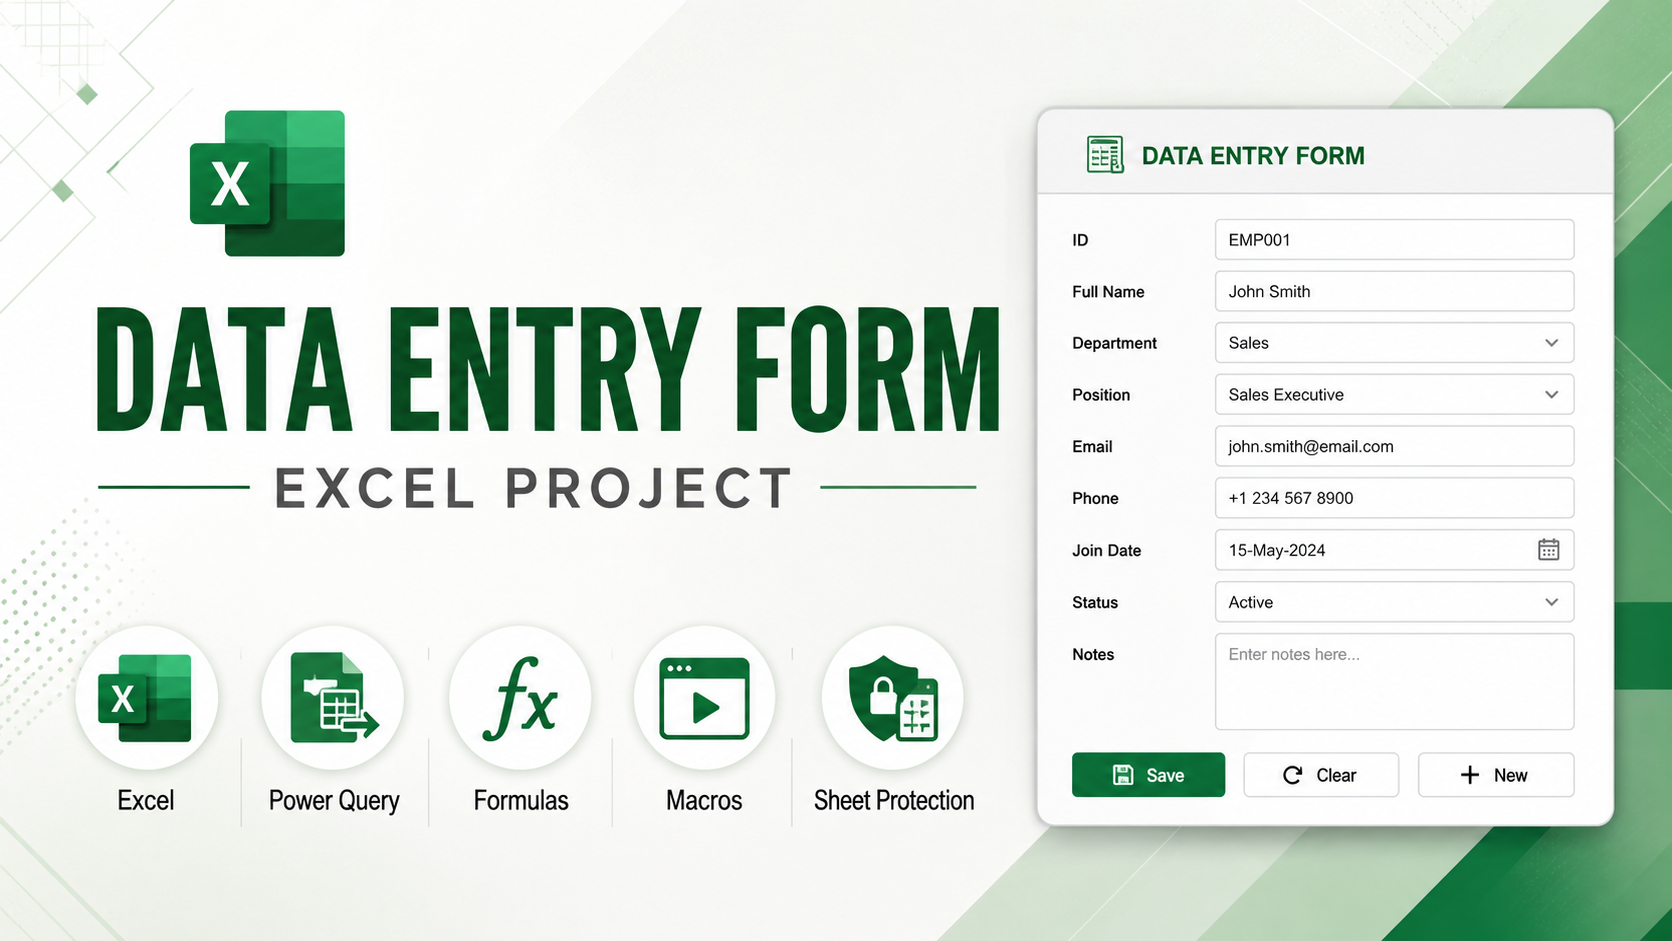
Excel automation form with dependent dropdowns, protected sheets, macros, and controlled data-entry workflow.
Automated Excel loan dashboard for applications, funded amounts, repayments, borrower profiles, and financial KPIs.
Excel dashboard project for tracking sales performance across categories, time periods, trends, and business segments.
Excel forecasting project comparing forecast functions, trendlines, and forecast sheets for short-term view prediction.
Cricket analytics project exploring IPL match results, team performance, venue patterns, scores, and win margins.
Focused credentials that support my analytics path across Microsoft Fabric, Power BI, SQL, Python automation, data quality, and BI delivery - with emphasis on practical skills that connect source data to trusted reporting outcomes.
Microsoft
Credential ID: 328E0B13B936B84
Microsoft
Credential ID: 8P4DENWO5D03
Certifier
Credential ID: fc4b2e5d-03d8-4e0a-b488-aa82e76a26dc
NamasteSQL
Credential ID: 6BF65AD5258E9856
Coursera
Credential ID: LKDMPM2N2UBR
IBM
Credential ID: FZ7CCQI4BEL7
Maven Analytics
Credential ID: 121103874
Maven Analytics
Credential ID: 163975540
Maven Analytics
Credential ID: 120905627
Maven Analytics
Credential ID: 120108608
Maven Analytics
Credential ID: 12057124
Maven Analytics
Credential ID: 121199649
Maven Analytics
Credential ID: 120034733
Want a professional portfolio website like this- Choose a source-code package or a complete setup customized for your profile.
I am looking for Data Analyst, Power BI Developer, BI Analyst, Reporting Analyst, and data operations roles where I can work on SQL, data cleaning, automation, KPI logic, and dashboard delivery.
I can work from raw data to final reporting: collecting files, cleaning duplicates, validating fields, writing SQL queries, preparing Excel outputs, building Power BI models, and automating repeated manual steps with Python.
I check source counts, remove or flag duplicates, validate missing values, document KPI logic, reconcile totals, and review filters before sharing dashboards or reports.
My main tools are SQL, Power BI, DAX, Power Query, Excel, Python, pandas, PostgreSQL, Microsoft Fabric, and browser automation tools such as Playwright and Selenium.
I come from a Civil Engineering background, so I am comfortable with structured problem solving, checking details, documentation, and accuracy. I apply the same discipline while working with business data.
Yes. I am open to Pune-based, hybrid, and remote opportunities, especially roles where I can contribute to cleaner data workflows, automation, and reliable reporting.
The best way is through LinkedIn, email, or the Get in touch button in the contact section. For quick discussions, WhatsApp is also available from the Connect links.